Check Performance

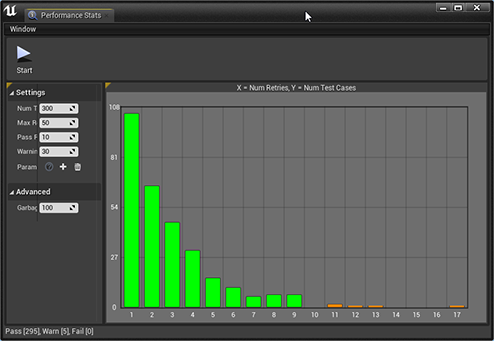
Find bottlenecks in your dungeon graph designs and optimize them using the Performance Analyzer. It shows how many attempts were made to build the dungeon.
It is normal for a dungeon to make multiple attempts before converging to a solution. However, if your dungeon design doesn't provide good opportunities for it to converge, they would show up here and you can fix them
Run Performance Analyzer
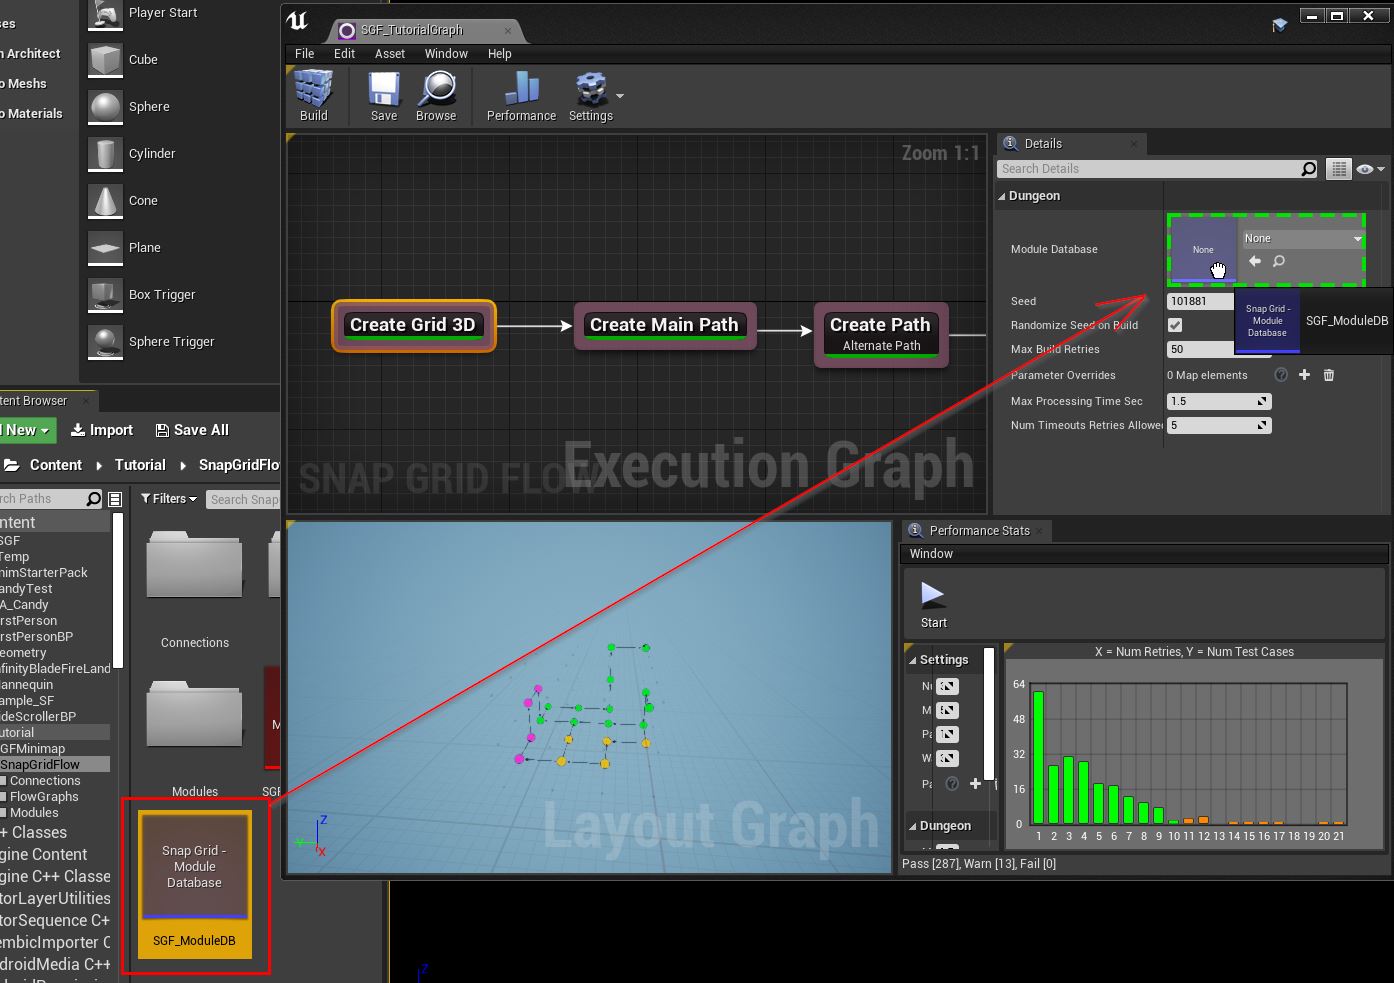
Open up our flow graph editor and reassign the Module database in the Editor Settings, as we've done previously

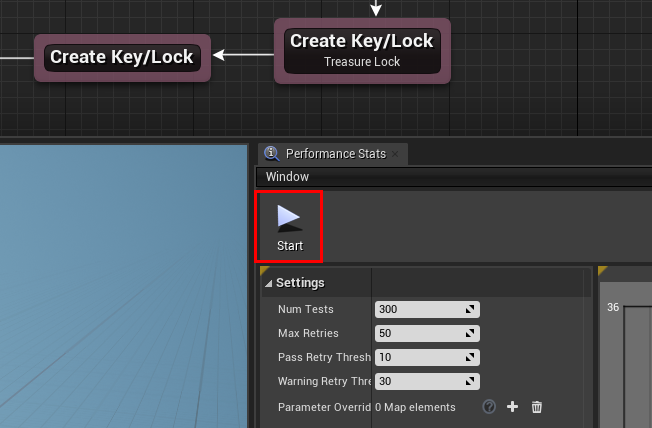
Please the Play button on the Performance Stats window


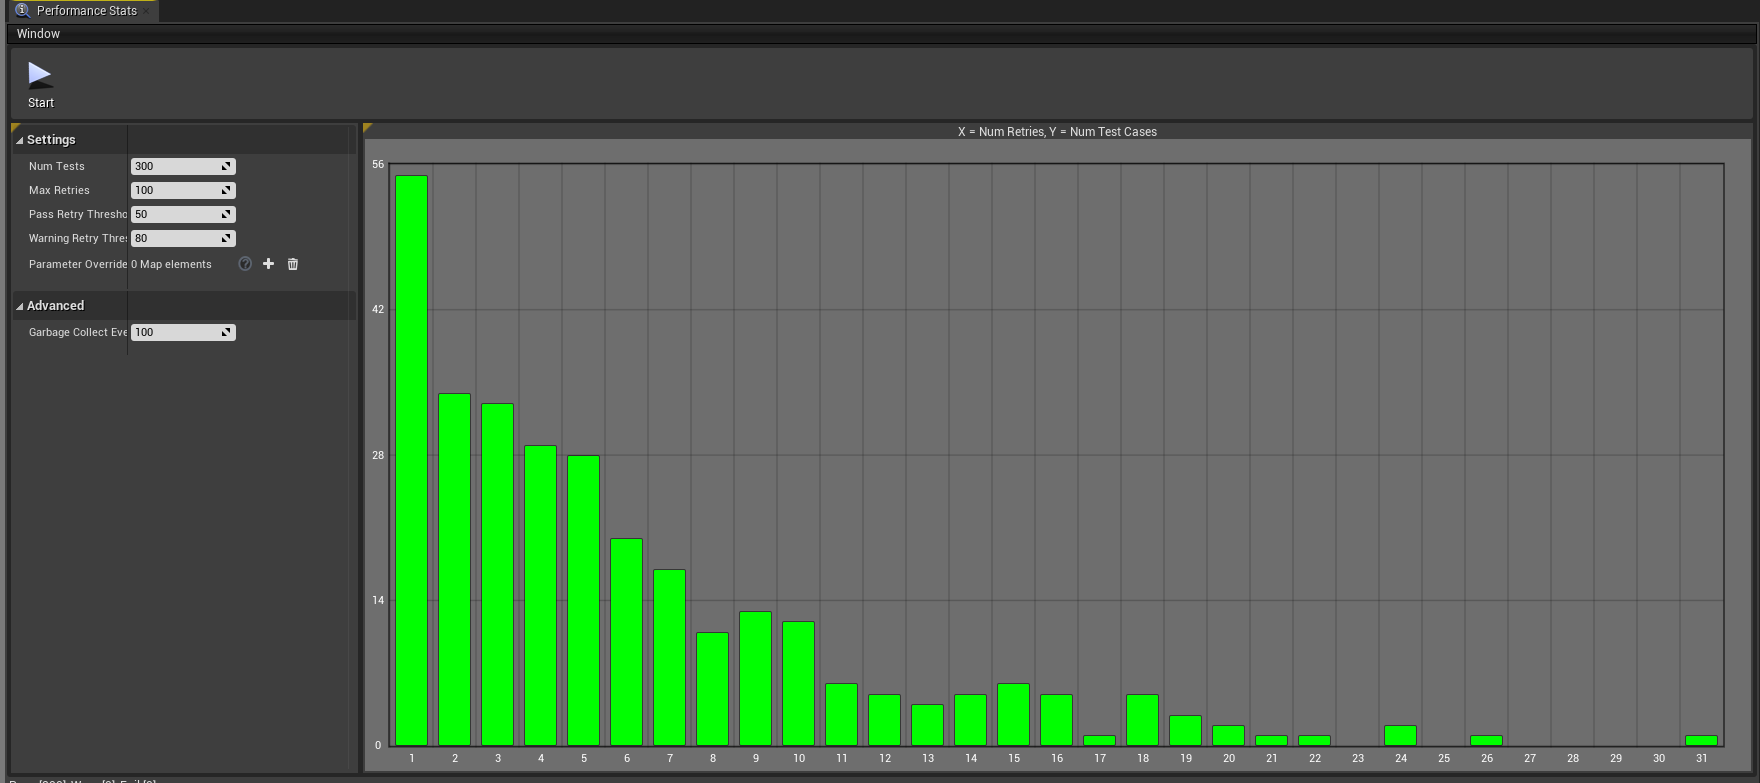
We are running 300 test cases, where we generate random dungeons with current graph setup. Each test case will take a certain number of retries before converging to a solution
The number of retries is represented in the X-axis. The number of test cases is represented in Y-axis
The current results are good as they mostly converge to a solution within a few tries. You may come back here and inspect the performance as you are designing your graph.